OpenShift Service Mesh Getting Started Guide

Overview
In this article we will explore the OpenShift Service Mesh and deploy a demo application to better understand the various concepts. First you might be asking yourself, why do I need a Service Mesh? If you have a microservice architecture then you likely have many services that interact with one another in various ways. If a downstream service breaks, how will you know? How can you trace an error through all services to find out where it originated? How will you manage exposing new APIs/capabilities to users? Service Mesh provides the answer to those questions providing 1) Visibility across all microservices 2) Traceability through all of the microservice interactions and 3) Ruleset governing service versions and capabilities that are introduced into the environment. OpenShift Service Mesh uses Istio as the mesh, Kiali for the dashboard and Jaeger for traceability.
Install OpenShift Service Mesh
OpenShift Service Mesh enables visibility of traffic as is traverses all services within the mesh. In case of an error you can not only see what service is actually the source for the error but also are able to trace the API communications between services. Finally it allows us to implement rules, like balancing traffic between multiple ratings API endpoints or even sending specific users to an API version. You can even create a chaos monkey using the ruleset that will inject various errors so you can observe how failures are handled. A Service Mesh is critical for any complex microservice application and without it you are literally flying blind while adding technical debt unable to manage or monitor service interactions properly.
Create a new project
First we will create a project for hosting the service mesh control plane.
$ oc new-project bookinfo-mesh
Install OpenShift Service Mesh
Under the project booking-mesh go to Operator Hub and install Red Hat OpenShift Service Mesh, Red Hat OpenShift Jaeger and Kiali Operator.
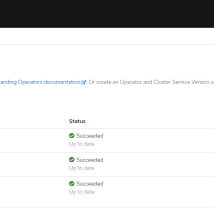
Configure OpenShift Service Mesh
Create a service mesh control plane using defaults.
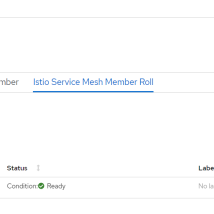
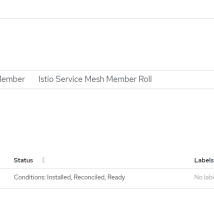 Create a service mesh member. Update the yaml and change namespace under controlPlaneRef to bookinfo-mesh.
apiVersion: maistra.io/v1
kind: ServiceMeshMember
metadata:
  namespace: bookinfo-mesh
  name: default
spec:
  controlPlaneRef:
    name: basic
    namespace: bookinfo-mesh
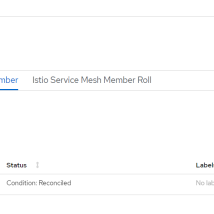 Finally create a service member role adding name of the project that will access the service mesh..
apiVersion: maistra.io/v1
kind: ServiceMeshMemberRoll
metadata:
  namespace: bookinfo-mesh
  name: default
spec:
  members:
    - bookinfo
Deploy Demo Application
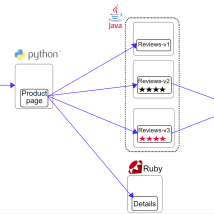
In order to look into the capabilities provided by the OpenShift Service Mesh we will deploy a simple book review app. The application is static but shows reviews for a book and has several microservices. The product page is the entry point service. It provides information on books and their reviews. It accesses book reviews through the reviews service which is also accesses the ratings service downstream to allow users to give a book a rating. It also gets details about a book via the details service. Like a true polyglot all services are written in a different programming language. The ratings service provides three different API versions, v1 doesn't display ratings, v2 shows ratings in black and v3 shows ratings in red. The idea is all about innovating quickly and getting real user feedback to take the app in the right direction.
Create a project for the book app.
Create a project to host the book app.
$ oc new-project bookinfo
Deploy book app.
$ oc apply -n bookinfo -f https://raw.githubusercontent.com/Maistra/istio/maistra-2.0/samples/bookinfo/platform/kube/bookinfo.yaml
Create a service mesh gateway.
Once the app is deployed we need to create a gateway and setup the URI matches.
$ oc apply -n bookinfo -f https://raw.githubusercontent.com/Maistra/istio/maistra-2.0/samples/bookinfo/networking/bookinfo-gateway.yaml
Create service mesh rule set.
Since the ratings service has 3 API versions we need some rules to govern the traffic.
$ oc apply -n bookinfo -f https://raw.githubusercontent.com/Maistra/istio/maistra-2.0/samples/bookinfo/networking/destination-rule-all.yaml
Access the application.
Get the route to the application and add the /productpage to access via web browser.
$ export GATEWAY_URL=$(oc -n istio-system get route istio-ingressgateway -o jsonpath='{.spec.host}')
$ echo $GATEWAY_URL
http://istio-ingressgateway-bookinfo-mesh.apps.ocp4.rh-southwest.com/productpage

If you refresh the web page you should see the ratings change between no ratings, black and red. This is because the ruleset is sending traffic to all three API endpoints (v1, v2 and v3).
Update Service Mesh Ruleset
As mentioned we can create rules that enable us to send certain traffic to a different API endpoint. This could be for a canary deployment where we want to test how users interact with different capabilities (red or black ratings stars), to perform a blue/green deployment upgrading to a newer API version or even sending different users to different APIs.
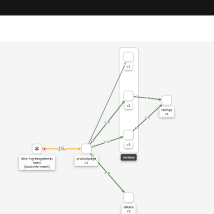
In this case we will simply apply a new rule that only sends traffic to v2 (black) and v3 (red) ratings API.
Apply a new ruleset.
$ oc replace -f https://raw.githubusercontent.com/istio/istio/master/samples/bookinfo/networking/virtual-service-reviews-v2-v3.yamlNow when you access the book app and refresh you should see it switched between red and black ratings.
Looking at Kiali versioned app graph we can see that traffic is only going to v2 and v3 as we would expect.
Troubleshooting Errors
As mentioned one of the key values of the OpenShift Service Mesh is the visualization and tracing. In order to generate an error we will scale down the ratings v1 deployment to 0.
$ oc scale deployment/ratings-v1 -n bookinfo --replicas 0
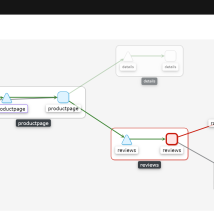
You should now see that the ratings service is currently unavailable when you refresh the app in a browser.
Check Kiali dashboard.
You can access Kiali via route under networking in the bookinfo-mesh project. In Kiali we clearly see the issue is the reviews service as we would expect.
Open Jaeger to trace the calls that are failing.
Next we can dig into the requests by opening distributed tracing (Jaeger) from the Kiali dashboard. We can see the flow of all calls grouped and identify all request to the ratings service that are throwing an error. We see a 503 is returned which means service in unavailable.
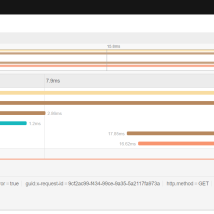
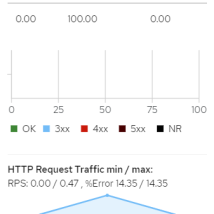
Kiali dashboard also shows request response (latency in ms) for slowest 50%, 95% and 99% of requests. This allows us to not only see the average latency but compare it to the slowest requests which indicates if we have spikes that could cause user slowness that we might not easily see when looking at just the average.
Summary
In this article we discussed the capabilities OpenShift Service Mesh provides for microservice applications. We deployed a service mesh and a book demo polyglot application that leverages the OpenShift Service Mesh. Using Kiali we saw how to gain visibility into our microservice application and easily identify problems as well as trends. Through Jaeger and distributed tracing we were able to identify the exact API causing error conditions. Microservice architectures provide a lot of value but they are harder to manage, control and troubleshoot in certain aspects than their monolithic peers which is why OpenShift Service Mesh is so critical.
(c) 2021 Keith Tenzer

