
Temporal Cloud Observability
![]()
Overview
In this article we will show how setup and configure Temporal cloud observability. The Temporal cloud exposes metrics through a prometheus query endpoint. This makes direct consumption in Grafana or anything that works with PromQL trivial. If you need a standard, non-PromQL scrapping endpoint, that isn’t a problem either as Temporal provides an adapter to convert from PromQL, for example for integration with DataDog. For every Temporal cloud account you can create an observability endpoint. You are able to filter metrics based on namespaces owned by the account.
Metrics
Below is a list of metrics provided by the Temporal cloud observability endpoint as of today.
- temporal_cloud_v0_frontend_service_error_count
- temporal_cloud_v0_frontend_service_request_count
- temporal_cloud_v0_poll_success_count
- temporal_cloud_v0_poll_success_sync_count
- temporal_cloud_v0_poll_timeout_count
- temporal_cloud_v0_service_latency_bucket
- temporal_cloud_v0_service_latency_count
- temporal_cloud_v0_service_latency_sum
- temporal_cloud_v0_state_transition_count
- temporal_cloud_v0_total_action_count
- temporal_cloud_v0_workflow_cancel_count
- temporal_cloud_v0_workflow_continued_as_new_count
- temporal_cloud_v0_workflow_failed_count
- temporal_cloud_v0_workflow_success_count
- temporal_cloud_v0_workflow_terminate_count
- temporal_cloud_v0_workflow_timeout_count
Configuring Observability Endpoint
The first step is to configure the observability endpoint. In order do so you will need to be GlobalAdmin and have an mTLS cert. Verify you are meeting the requirements for mTLS certs.
Additionally for testing you can generate a root CA using our docker image.
$ docker pull temporalio/client-certificate-generation
$ docker run -v $PWD:/work -it temporalio/client-certificate-generation ca.sh
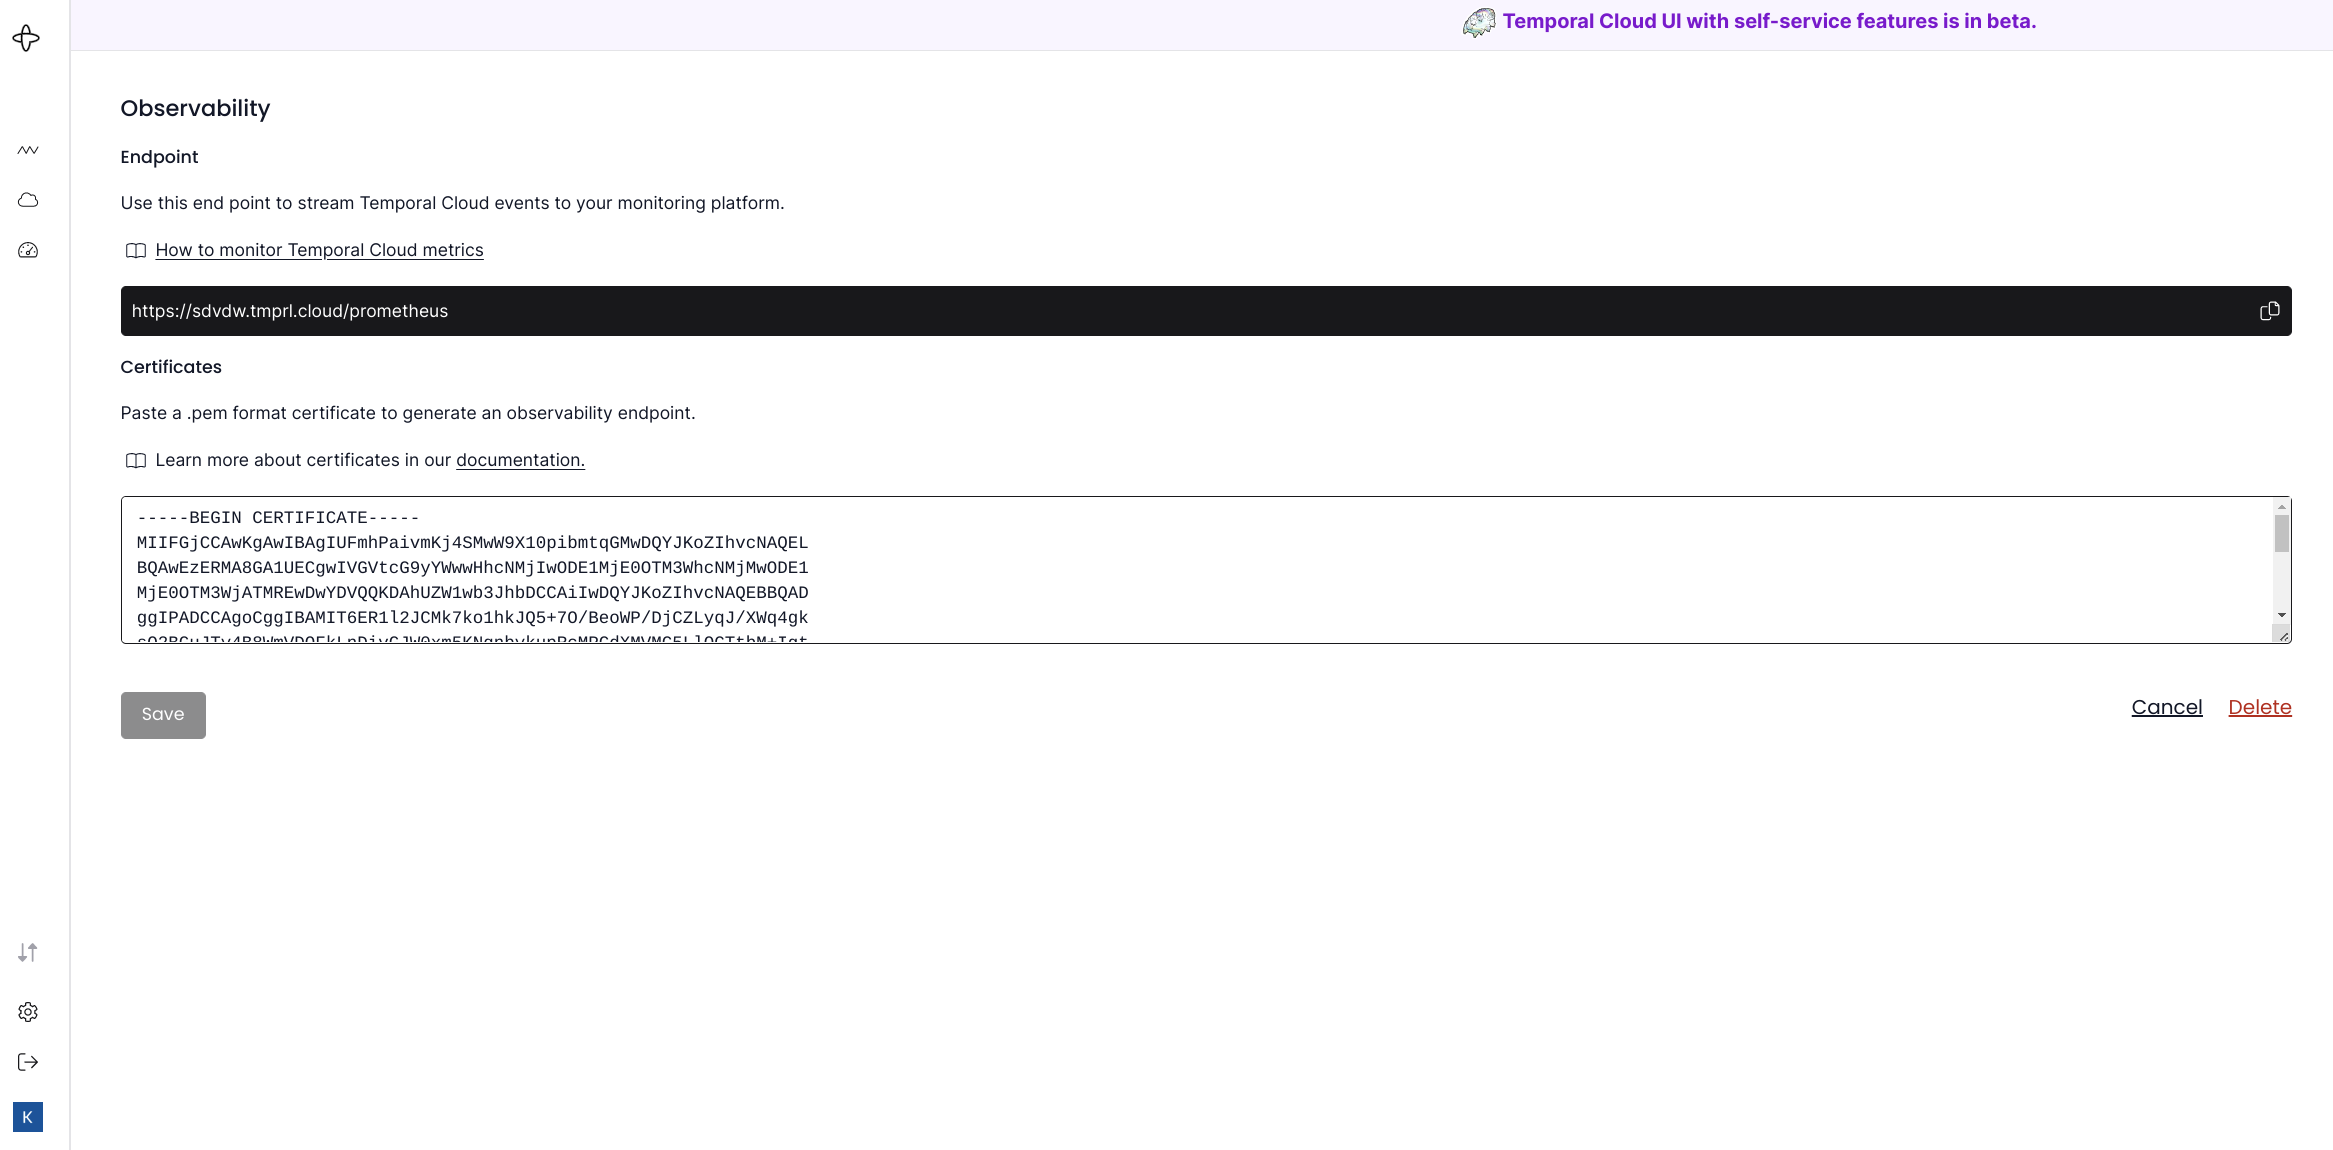
Next, providing the public pem certificate create an observability endpoint in the Temporal cloud UI by clicking Settings->Integrations.
Testing Observability Endpoint
Before we configure Grafana its a good idea to test and ensure the endpoint is working. If this is a new namespace or one with no workflows the data returned will be empty as is this case here.
$ curl --cert /home/ktenzer/temporal/certs/ca.pem --key /home/ktenzer/temporal/certs/ca.key https://sdvdw.tmprl.cloud/prometheus/api/v1/query?query=temporal_cloud_v0_state_transition_count
{"status":"success","data":{"resultType":"vector","result":[]}}
Configuring Grafana
Once the observability endpoint has been created, setting up Grafana involves two steps: creating a datasource and importing the dashboard from a json file.
Creating Datasource
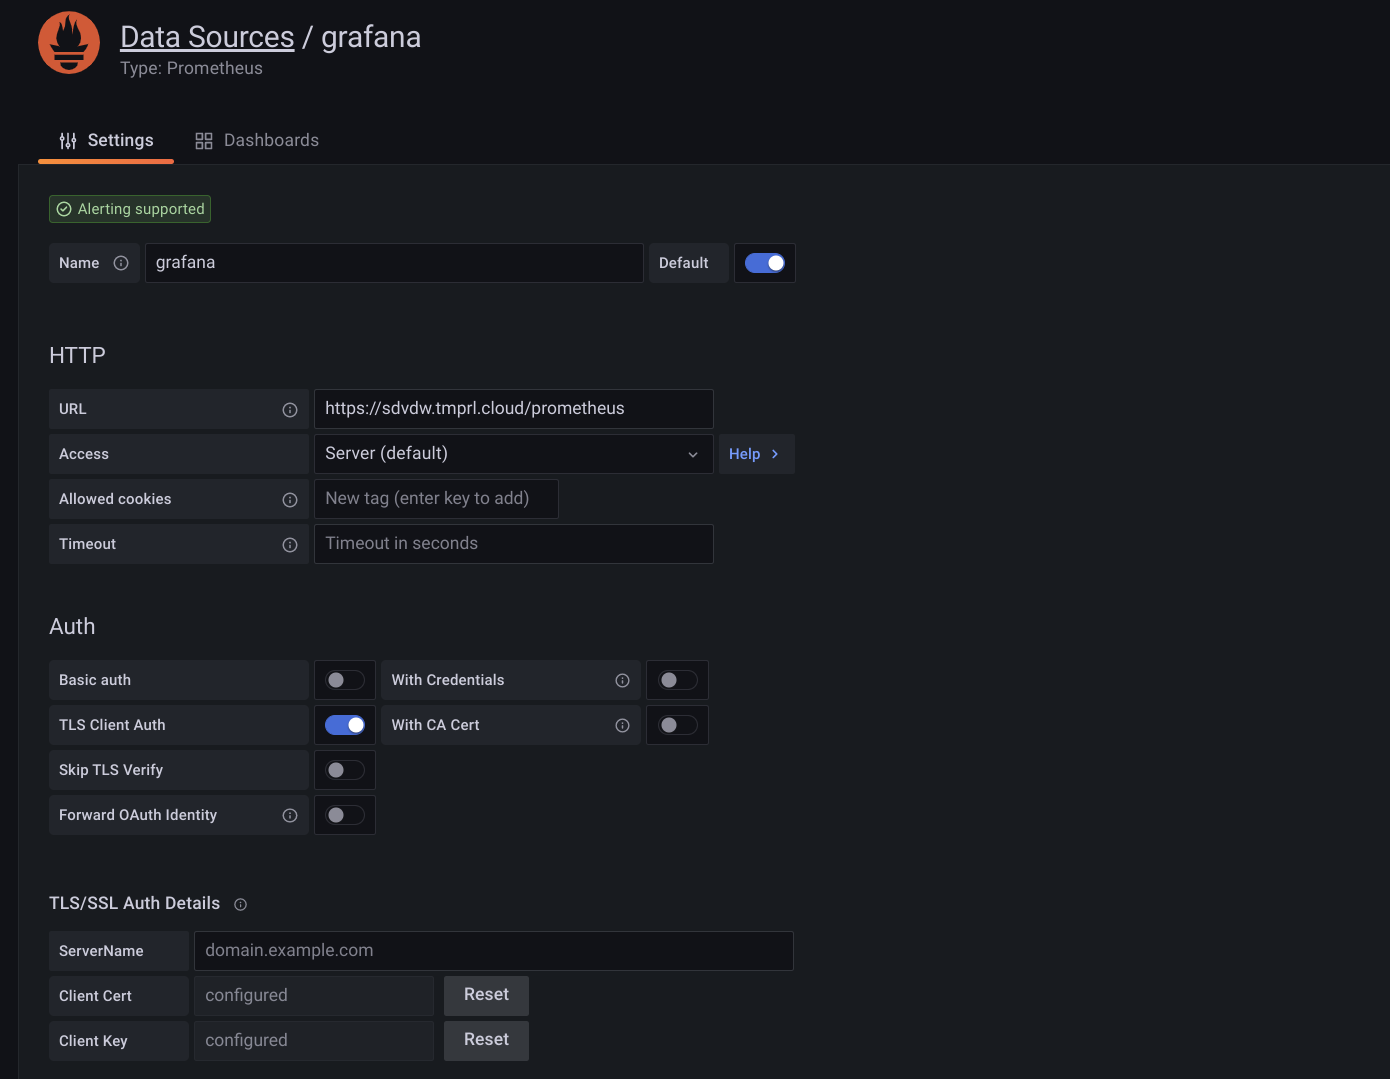
In Grafana under Setttings->Datasources add a new datasource. Simply copy the URL that was generated from the Temporal cloud, name the datasource ‘Temporal - AccountId’, enable TLS CLient Auth and add your certificates. The reason the datasource needs to be named ‘grafana’ is because that is uid used in the json file which maps it to the dashboard. At the bottom click ‘Save and Test’.
Note: naming the dashboard grafana will configure graphs to be randomWalk which means metrics are just generated randomly not pulled from actual data. This is more for testing the graphs.
Importing Dashboard
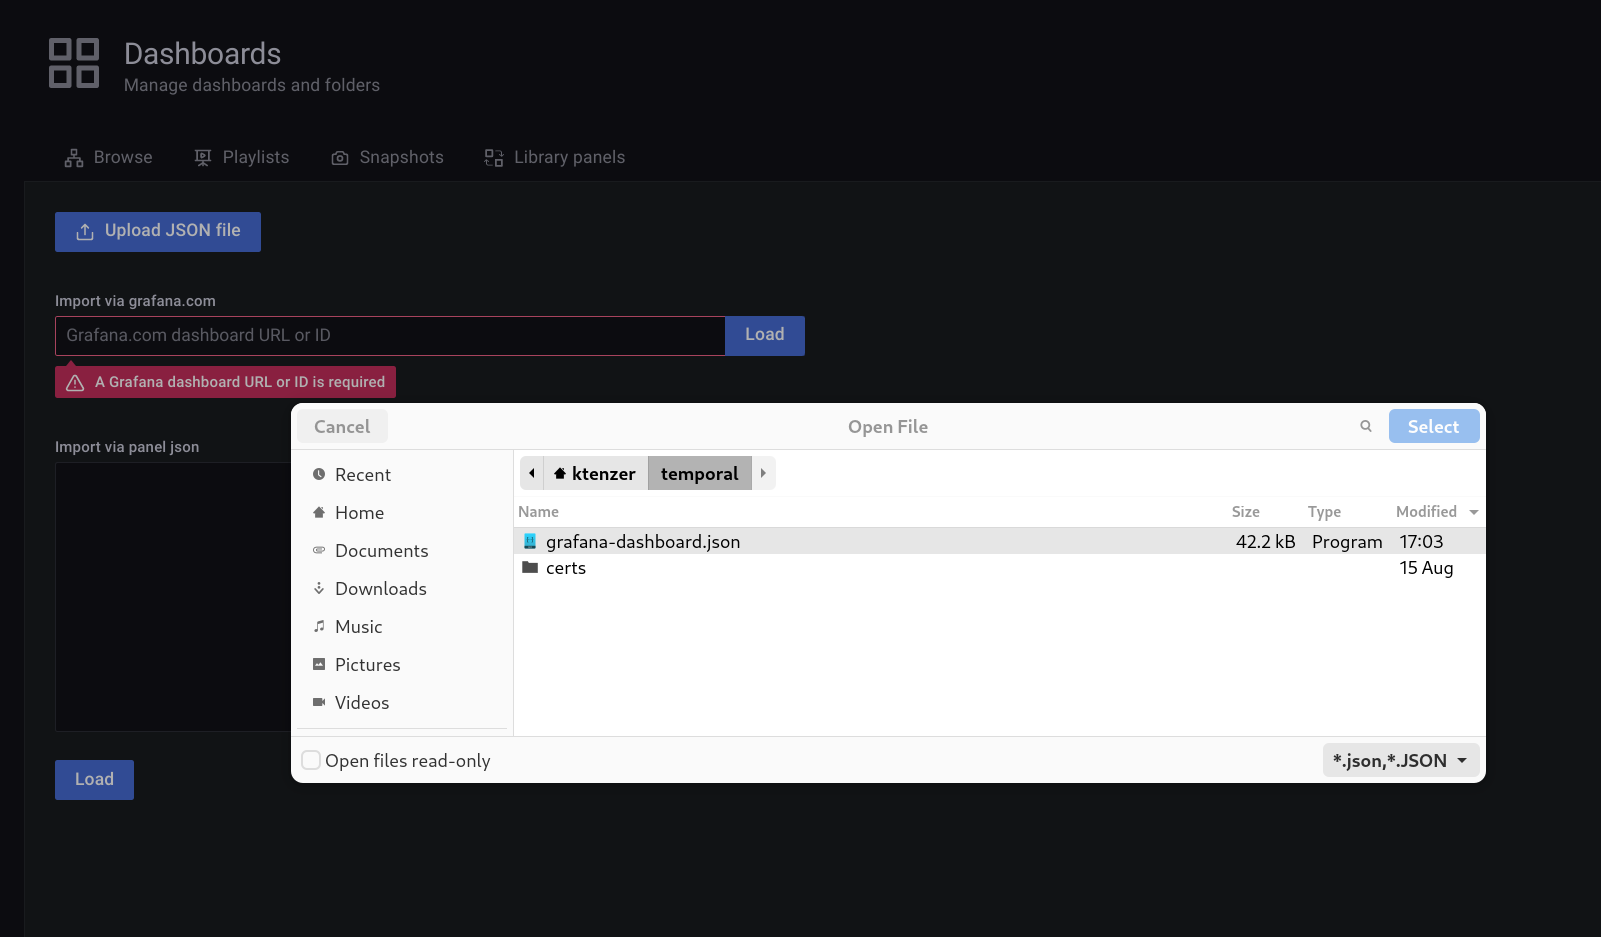
Now that our datasource exists we can import the Grafana dashboard by clicking Dashboard->Import. The Dashboard Json file is available here.
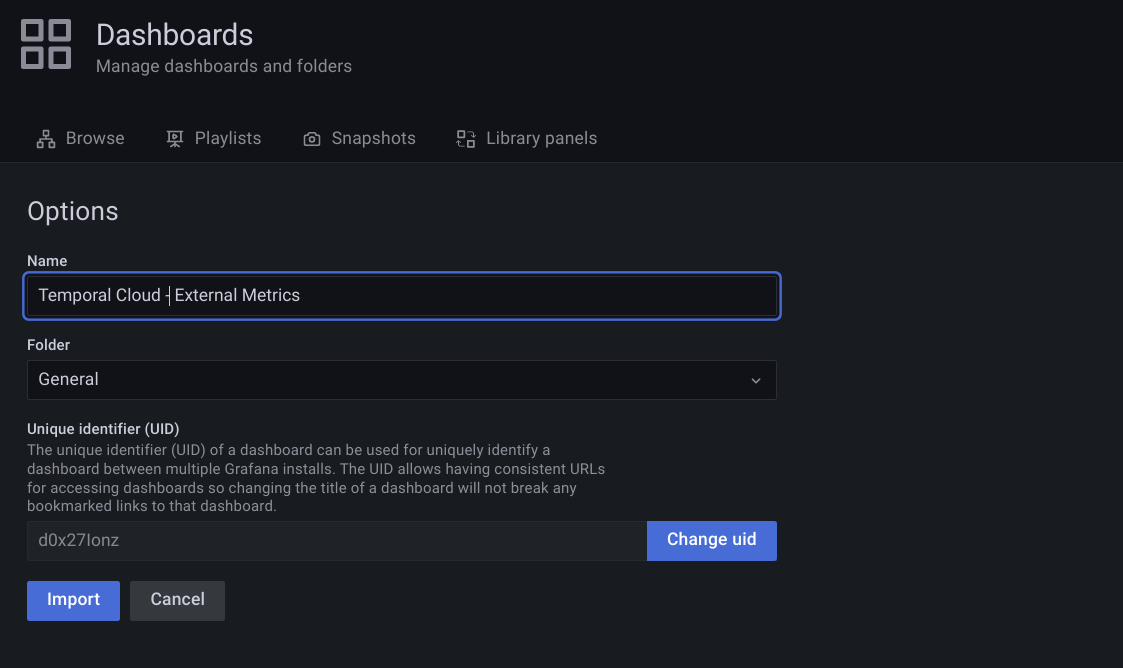
If everything worked you should now see a dashboard. Of course, you will need to run some workflows to see any data.
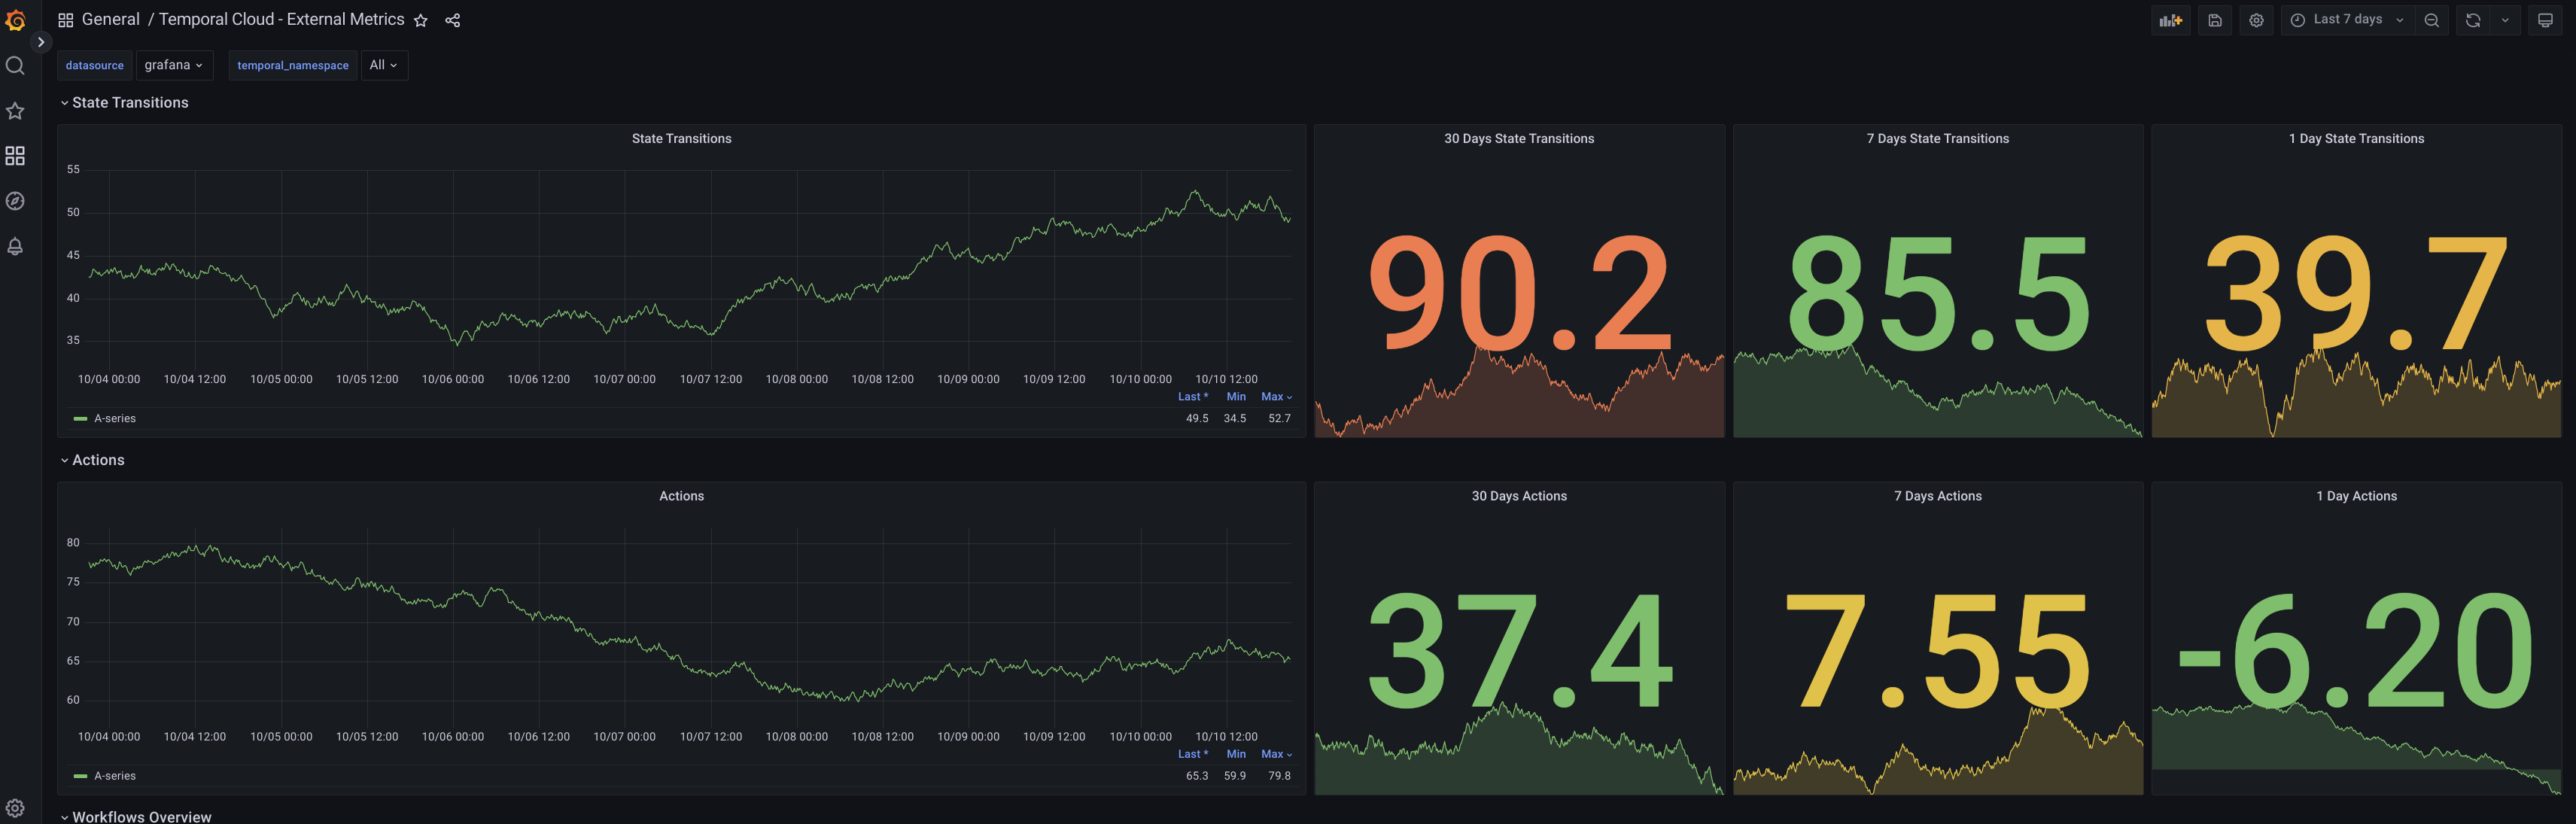
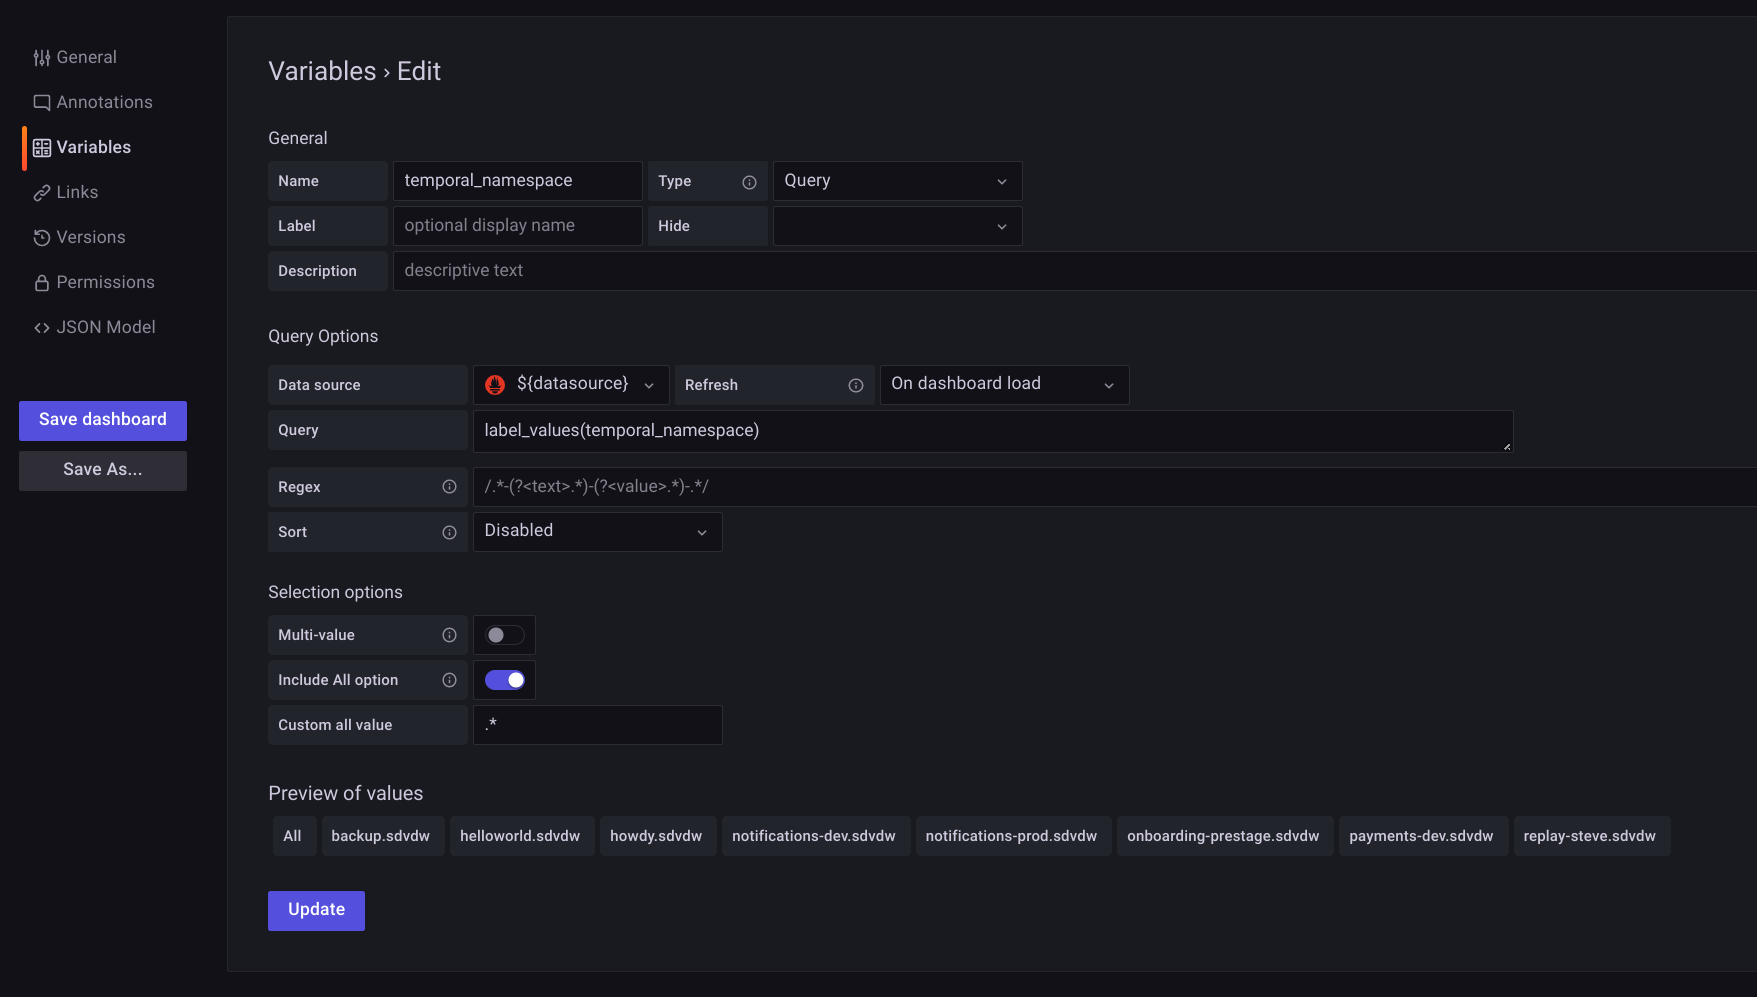
If you aren’t seeing data check to ensure temporal_namespace variable was created by the import. We need to define that so the metrics are filtered properly per namespace.
Summary
In this article we learned about how to configure Temporal cloud observability metrics. By generating a PromQL endpoint, creating a Grafana datasource and importing a Grafana dashboard we are easily able to view Temporal cloud metrics.
(c) 2022 Keith Tenzer