
OpenShift Showback Reporting using CloudForms
Overview
One of the most important capabilities of any platform in today's service driven, pay-as-you-go economy is metering and showback. Without a solid understanding of costs, organizations are in fact unable to provide services. With containers, metering and showback becomes more challenging. If we think about containers simply being processes, then we are basically needing to meter and perform showback at that level of granularity. In addition since OpenShift uses Kubernetes for container orchestration, there are additional concepts that are new. For example, one more more containers run together in what Kubernetes refers to as a Pod. Next Pods are extremely dynamic and their lifetime very short. All of this make metering and showback anything but straight-forward. Thankfully OpenShift and CloudForms have the solution.
OpenShift comes with Hawkular, a highly scalable, flexible, performant metric storage system based on Cassandra. Hawkular runs on OpenShift (as a container) and collects CPU, Memory, Disk and Network utilization for all Pods running in environment.
CloudForms is a multi-cloud management platform that integrates with many platforms including OpenShift. CloudForms is able to read the data from Hawkular, apply user-defined rates and provide report on costs for containers running in Pods on OpenShift. By default CloudForms is able to show these reports per project. Since an application or business will have multiple projects, showback should be ideally done based on a group of projects. In this article we will look at how to create showback reports from a group of interrelated projects in OpenShift using CloudForms.
Pre-requisites
In order to setup showback reports you will need an OpenShift environment and of course CloudForms. I tested with OpenShift 3.5 and CloudForms 4.5.
- Deploy CloudForms on Red Hat Enterprise Virtualization
- Deploy CloudForms on Azure
- Deploy OpenShift and Configure CloudForms
Label Projects in OpenShift
In OpenShift since orchestration is Kubernetes, everything can be labeled. In this case we want to label our OpenShift projects (Kubernetes namespace) so projects that belong together can be easily identified. For simplicity, we will call a group of OpenShift projects that have same cost center a box. Each box has a number, so it can be identified. Ideally the name of the project should also have the box for quick identification.
In the real-world you will most likely not want to allow developers to create projects directly in OpenShift. Instead you can use CloudForms and provide a service. Here you can ask end-user for a cost center or something to identify themselves and then ensure all projects that are created have that identifier in the name (optional) and label (required). You can also enforce quotas and of course would want to do that to ensure end-user's only get what they pay for.
List all projects that belong together
Here it is easy since they all have Box02 in display name. Again why you would want to optionally add identifier to project name.
[ktenzer@master1 ~]$ oc get projects |grep -i box
greetme-poc Box02: greetme-poc Active
greetme-norman-dev Box02: greetme-norman-dev Active
greetme-prod Box02: greetme-prod Active
greetme-workshop Box02: GreetMe-Workshop Active
greetme-dev Box02: greetme-dev Active
greetme-norman-prod Box02: greetme-norman-prod Active
Label all the projects that belong together
In this case we are labeling box02 projects.
[ktenzer@master1 ~]$ oc label namespace greetme-poc box=box02
namespace "greetme-poc" labeled
[ktenzer@master1 ~]$ oc label namespace greetme-norman-dev box=box02
namespace "greetme-norman-dev" labeled
[ktenzer@master1 ~]$ oc label namespace greetme-prod box=box02
namespace "greetme-prod" labeled
[ktenzer@master1 ~]$ oc label namespace greetme-workshop box=box02
namespace "greetme-workshop" labeled
[ktenzer@master1 ~]$ oc label namespace greetme-dev box=box02
namespace "greetme-dev" labeled
[ktenzer@master1 ~]$ oc label namespace greetme-norman-prod box=box02
namespace "greetme-norman-prod" labeled
Map Labels to Tags in CloudForms
Once projects have been labeled in OpenShift we need to map those labels to tags in CloudForms.
Refresh CloudForms Data
Go to the OpenShift provider in CloudForms and refresh relationships.
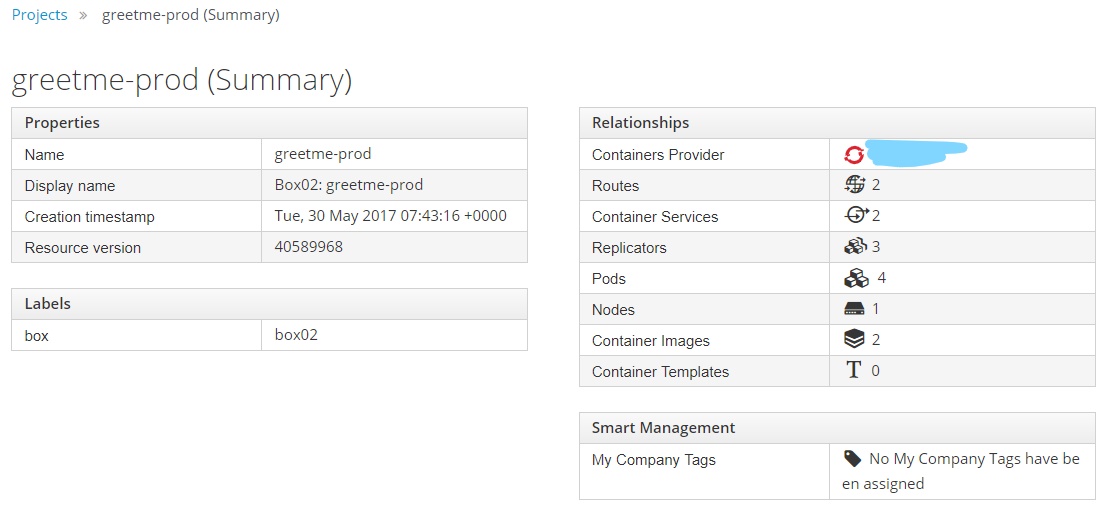
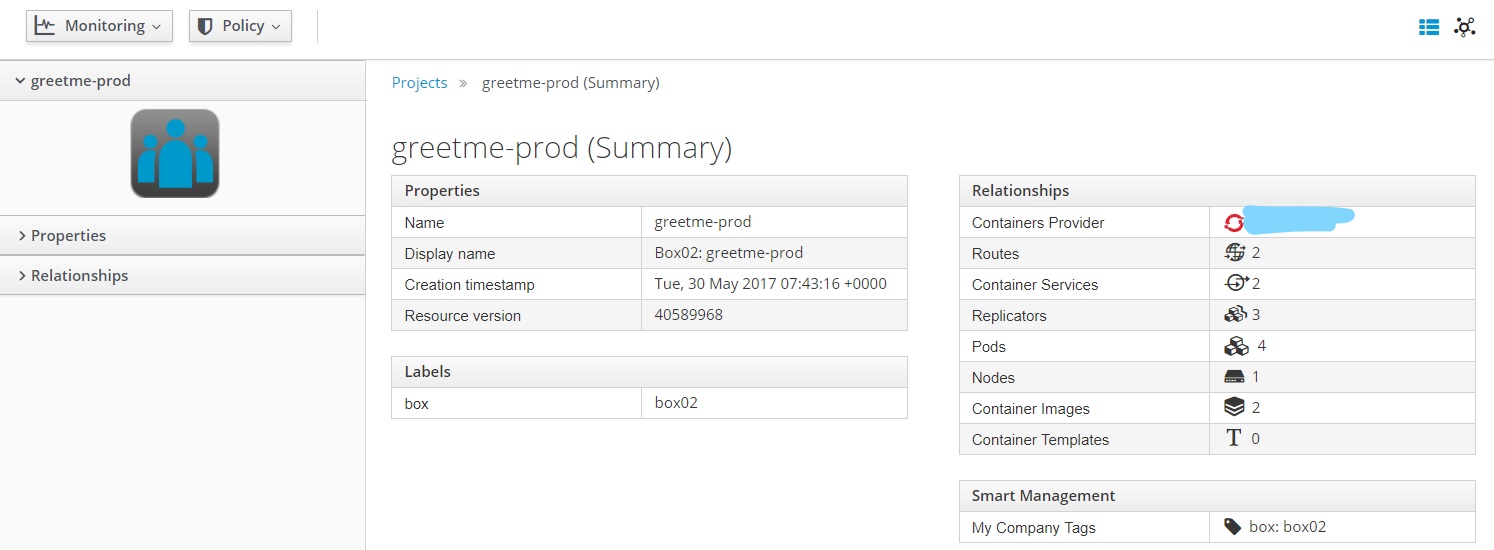
View Labels
OpenShift projects labels should now be visible in CloudForms. In this case box is the label and on our greetme-prod project it is set to the box02 label.
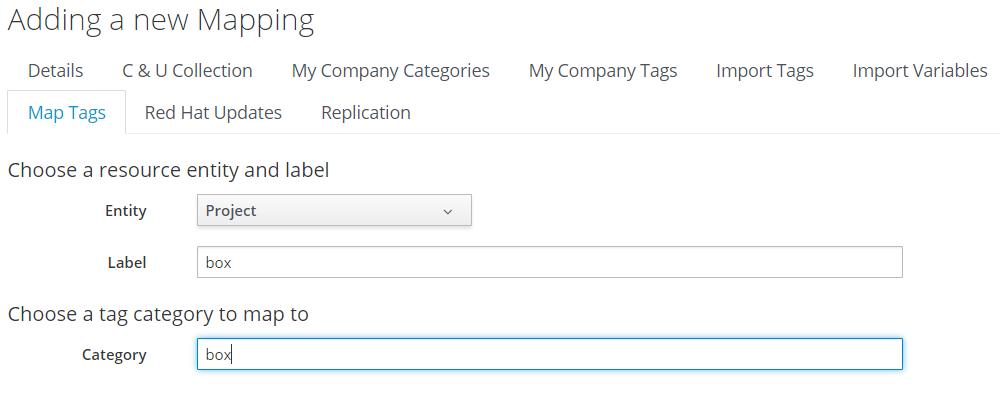
Map label to tag
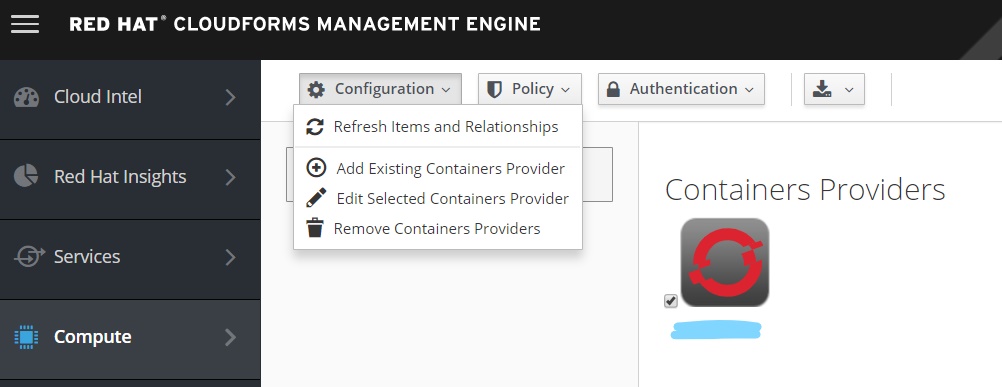
Under user->Configuration you can map labels to tags.
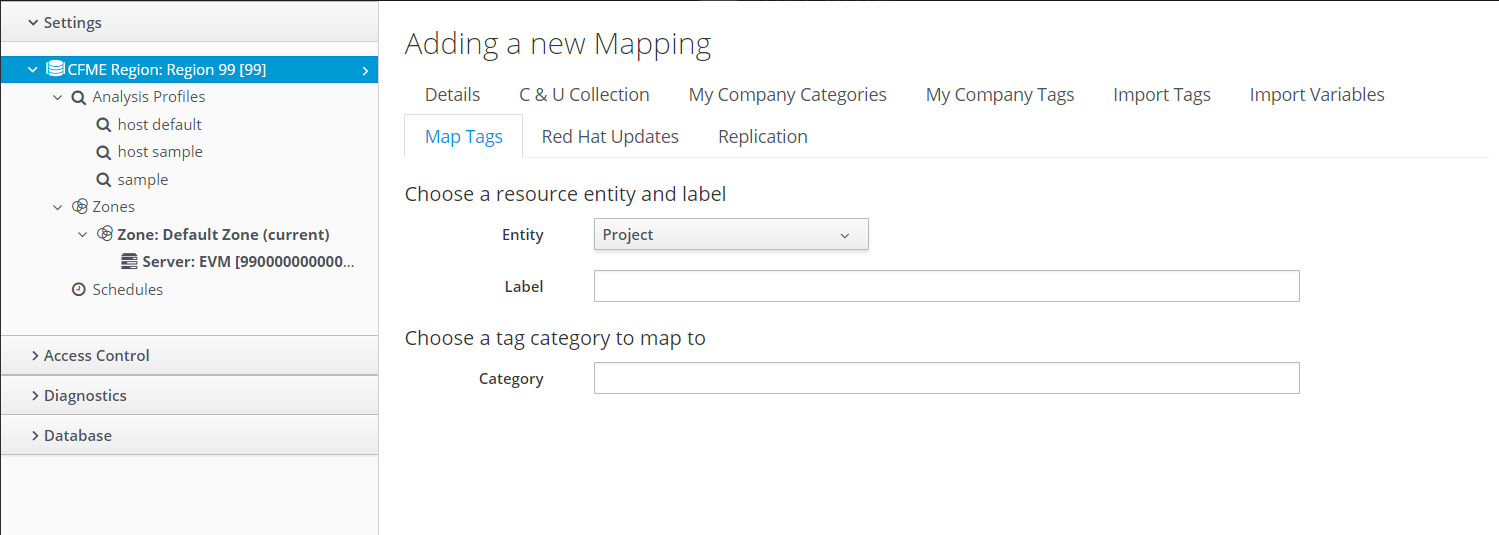
We will create a new mapping and simply map the OpenShift label box to a tag in CloudForms also called box. The mappings don't of course need to match.
Refresh CloudForms Data
Go to the OpenShift provider in CloudForms and refresh relationships. CloudForms needs to now discover the tags.
View Tags
Under the project, smart management tab we can now see the tag box: box02 has been applied.
Create Showback Reports in CloudForms
Once the labels exist in OpenShift and are mapped to tags we can start to generate reports and actually sort by tag. Here we will create two reports. One that shows showback costs for all boxes or tags and other for a specific tag like box02.
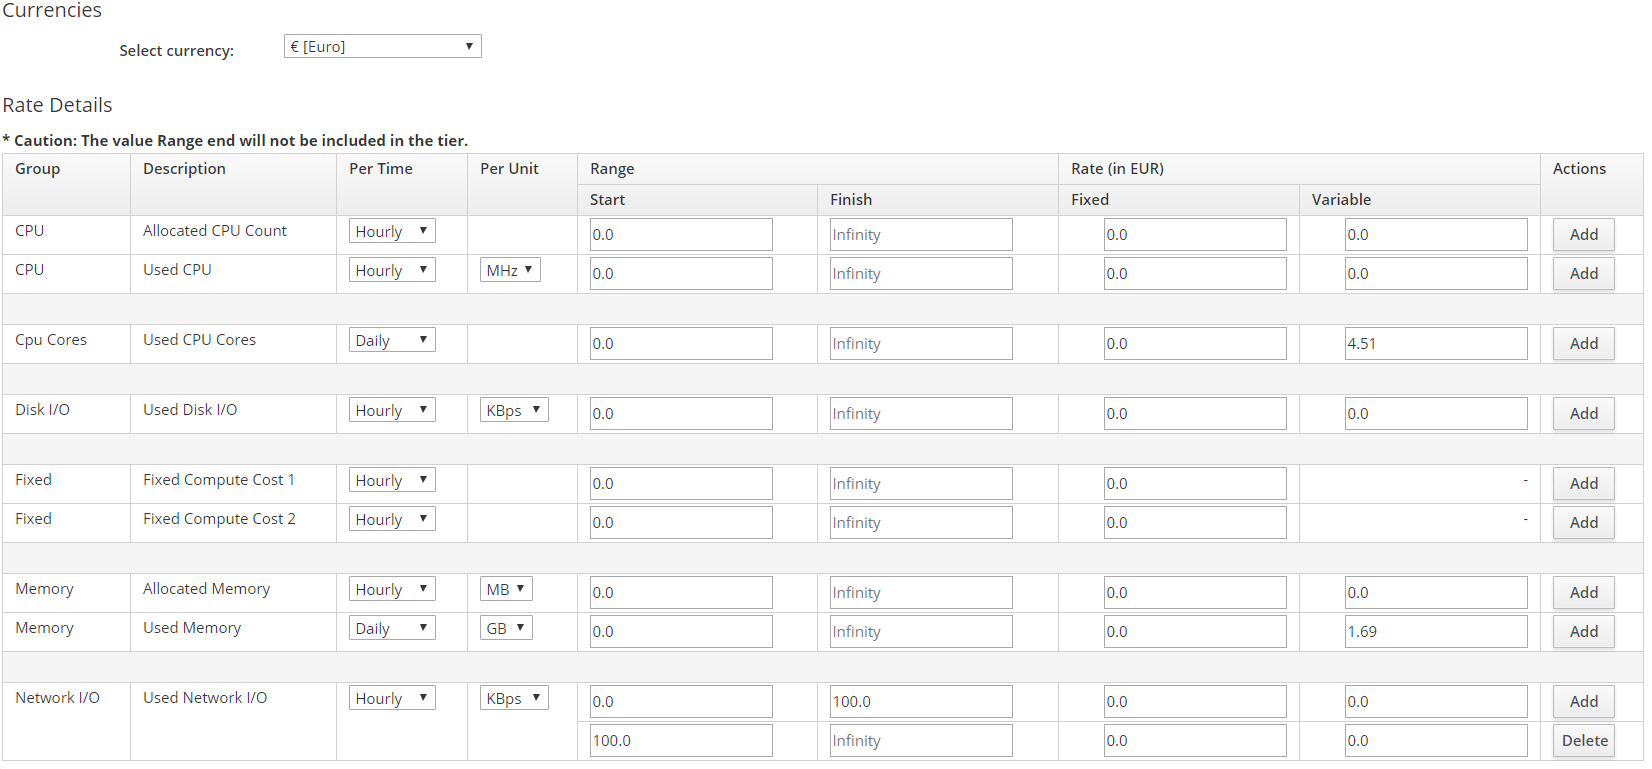
Create Showback Rates
Under "Cloud Intel->Chargeback>Rates" you can create your own rates. CloudForms lets you choose the currency and rates. You can either configure fixed or variable for CPU, Memory, Network I/O and Disk I/O. Finally CloudForms also lets you set ranges. You could have the first few CPU cores cost X and the rest cost Y, as example. Both reports will use the same showback rates.
Create Showback Report for all "box" tags
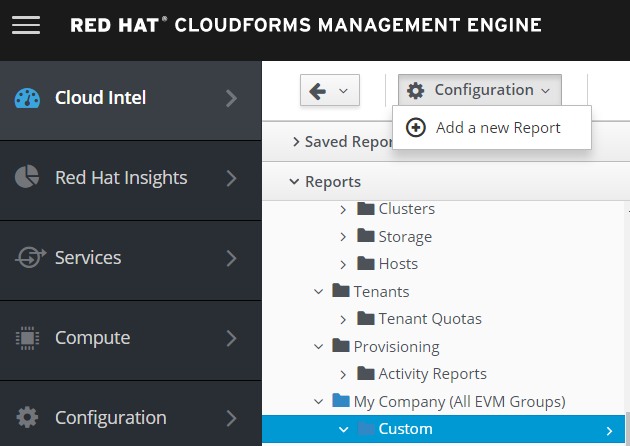
This report will show all boxes for our tag box and their cost. Under "Cloud Intel>Reports->Custom" add a new report.
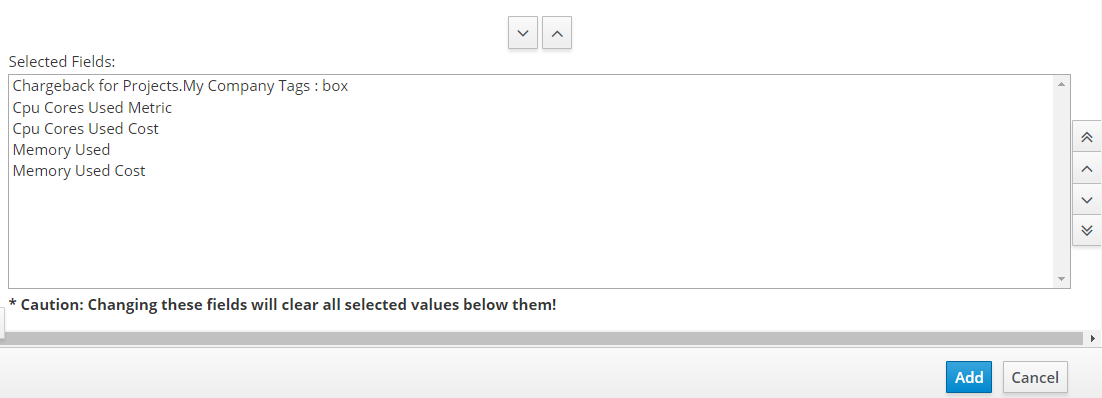
Name the report and select the fields that should be part of the report.
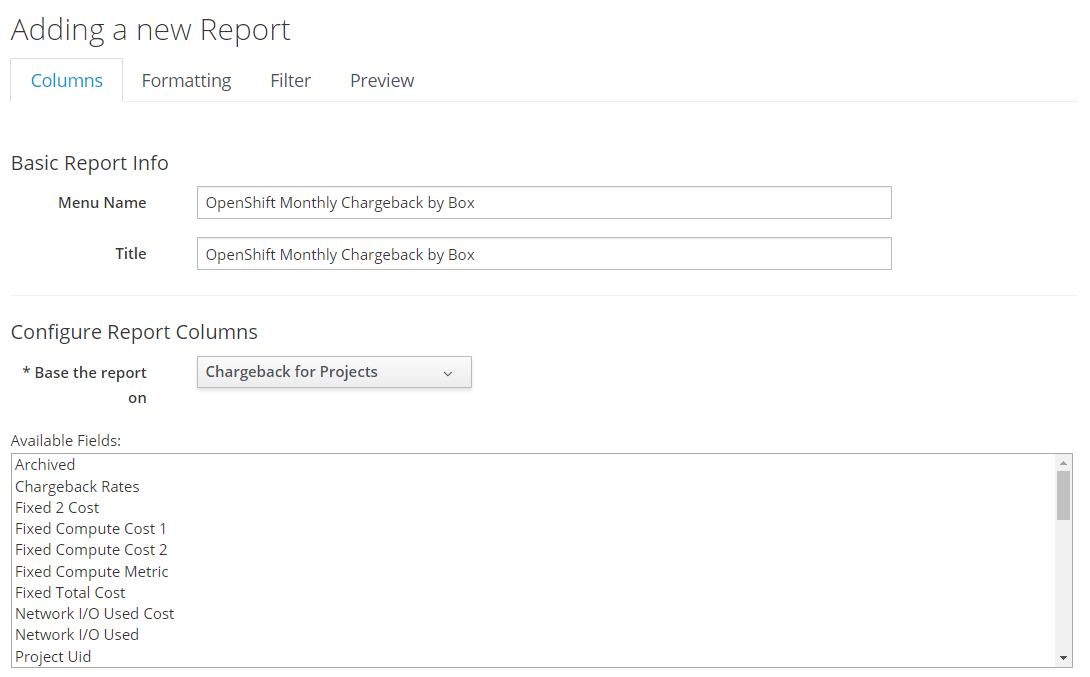
Here we have selected the tag and CPU / Memory used and cost.
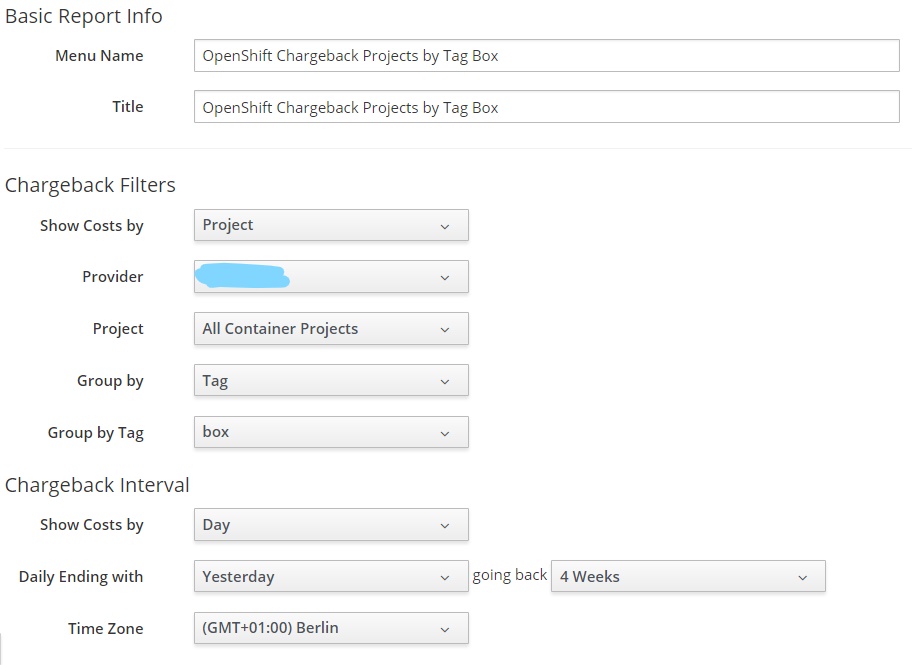
Under the "filter" tab of the report we need to define the filters. Select all projects and group by the tag box.
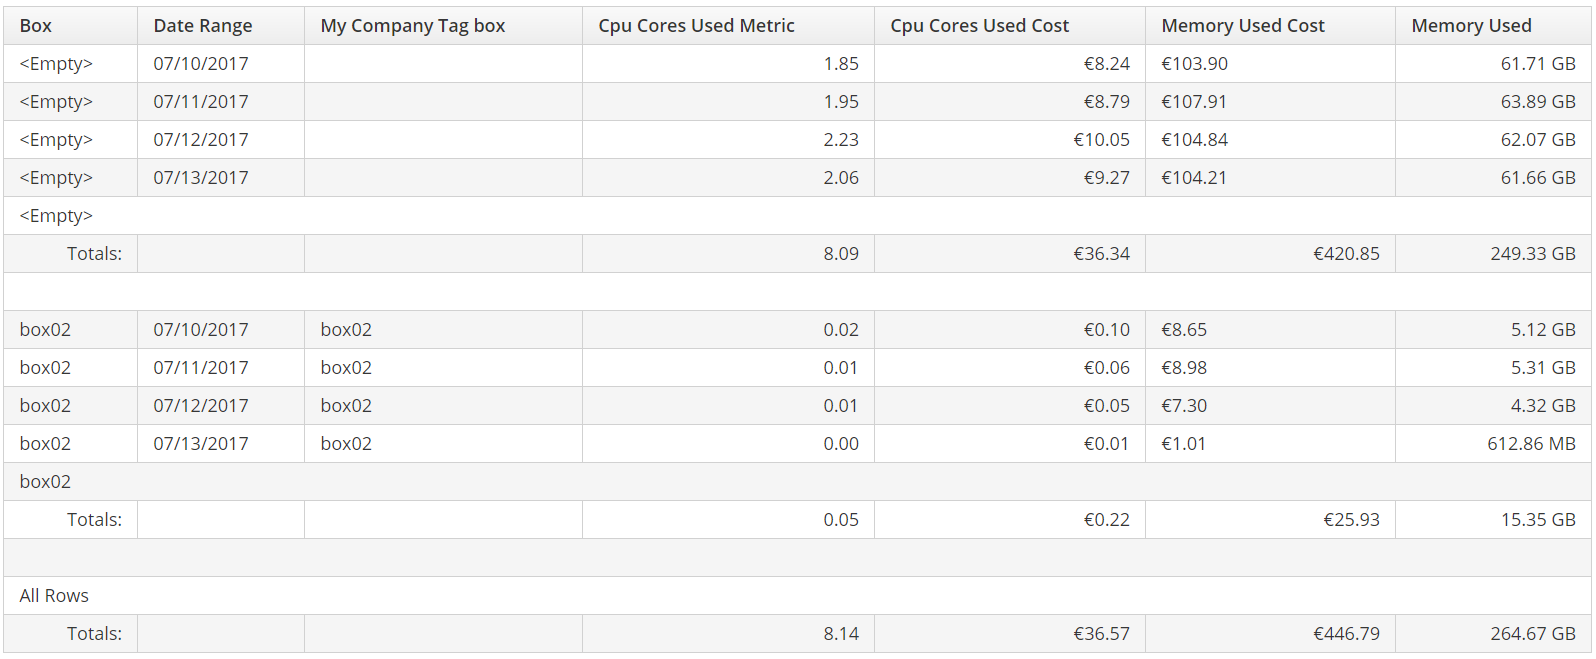
To run the report select the report and click queue. You can also generate the report under the preview tab. Below is the output. This report shows cost according to box (a group of OpenShift projects). It is a monthly report that shows total cost per day. In this case we only have box02. Notice the <empty> box. These are projects that are not associated to a box.
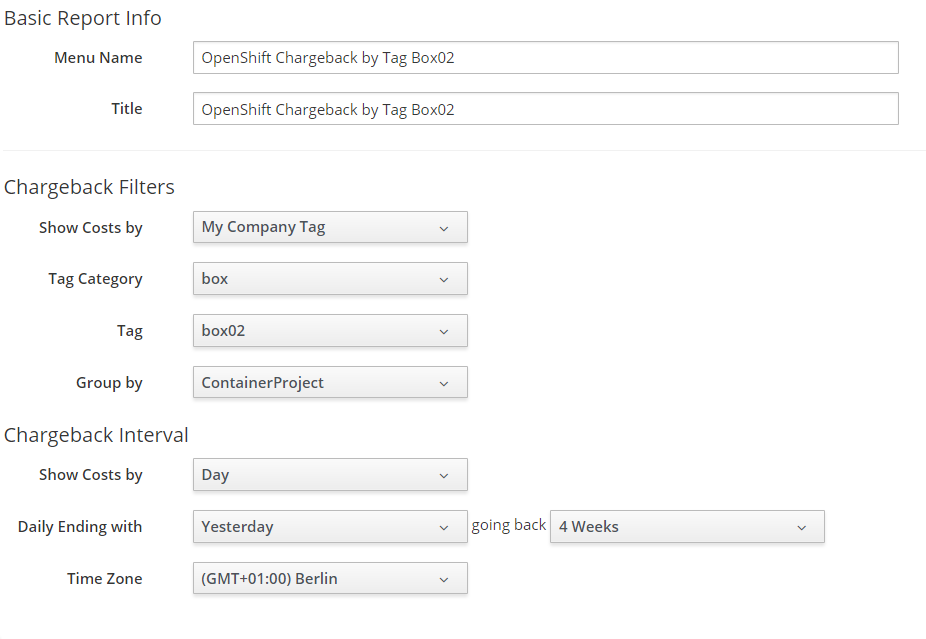
Create Showback Report for tag box02
In this report we want to only see projects that have the tag box02. Follow the same steps as above only this time change show costs, to tag and select the tag box02. Grouping should be done by project.
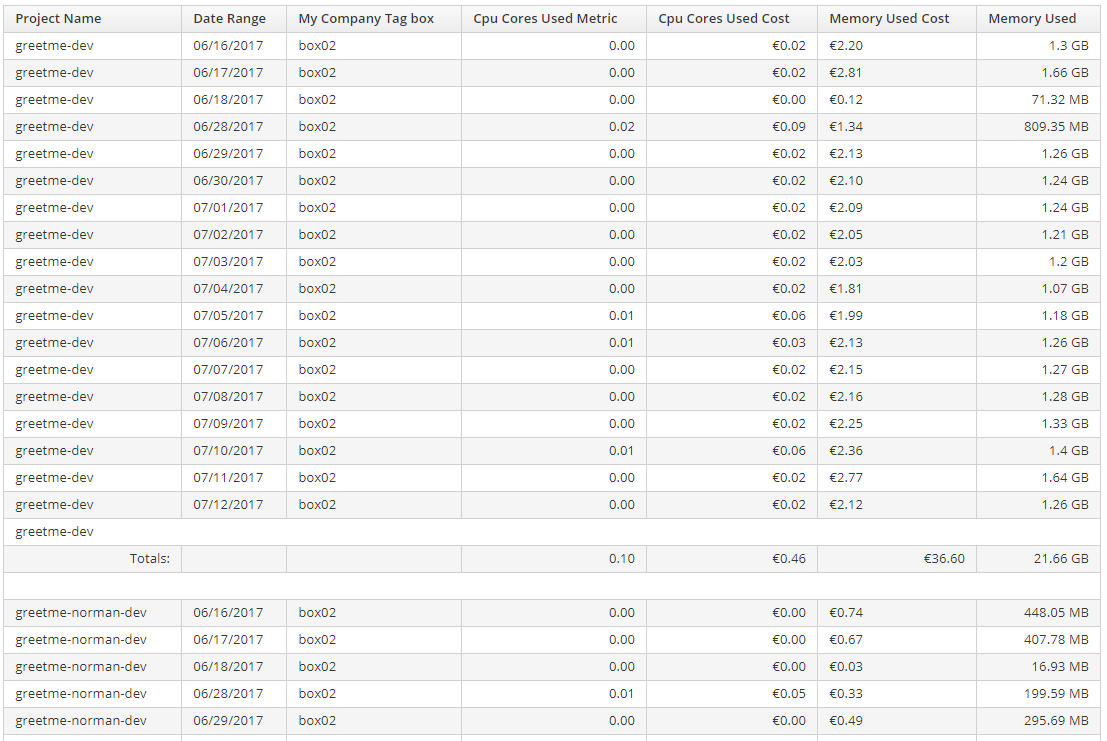
To run the report select the report and click queue. You can also generate the report under the preview tab. Below is the output. This report shows cost according to box02. We see all the projects that are part of box02 and their costs. It is a monthly report that shows total cost per day per project.
Summary
In this article we looked at how OpenShift and CloudForms integrate with one another to provide both metering and showback. This involves labeling OpenShift projects, mapping them to tags in CloudForms and building reports based on user-defined rates. We created a report to provide an overview of all tagged OpenShift projects and a report that shows only the projects of a specific tag. Hopefully this article provides some ideas and you have seen the possibilities that exist today for metering and providing showback of costs in OpenShift using CloudForms.
Happy OpenShifting!
(c) 2017 Keith Tenzer